Amgix v1.2.0: The Observability Release
Release of Amgix server v1.2.0 is now available.
New Features
Amgix Dashboard
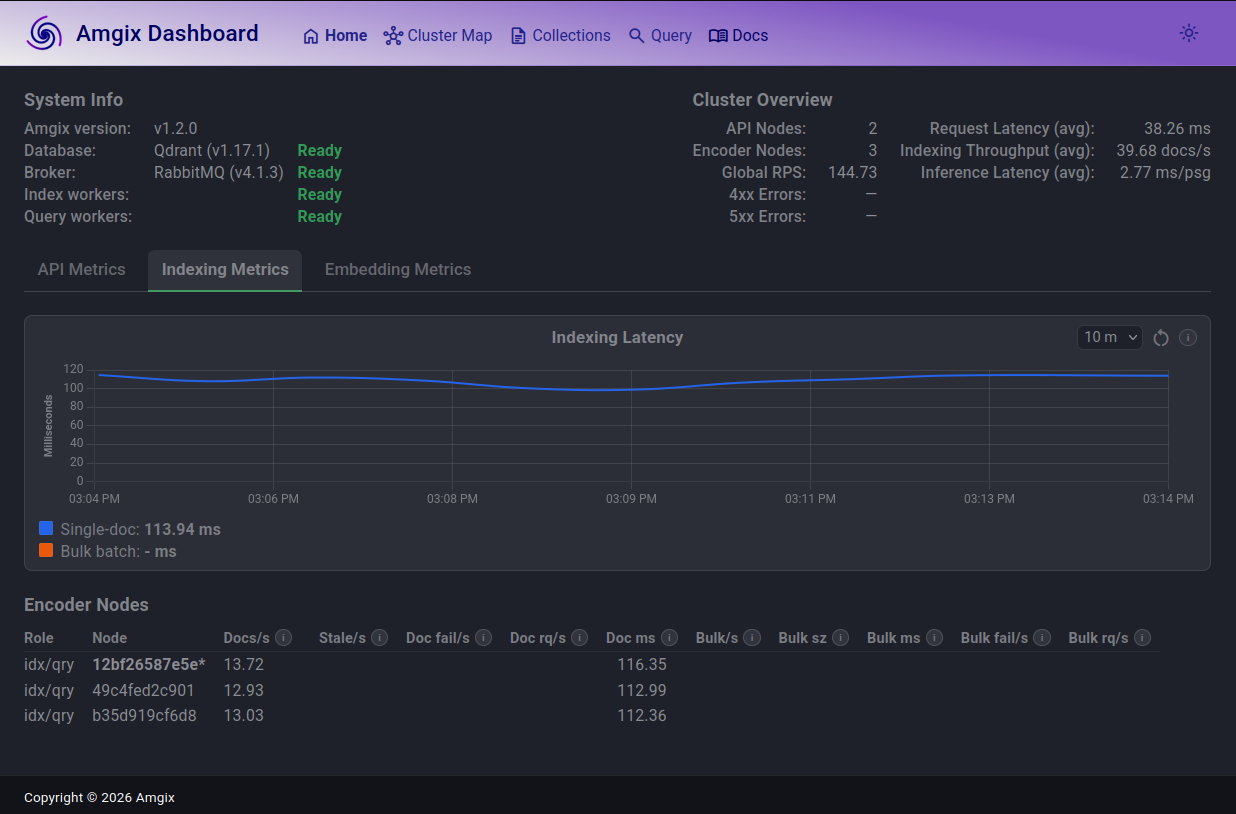
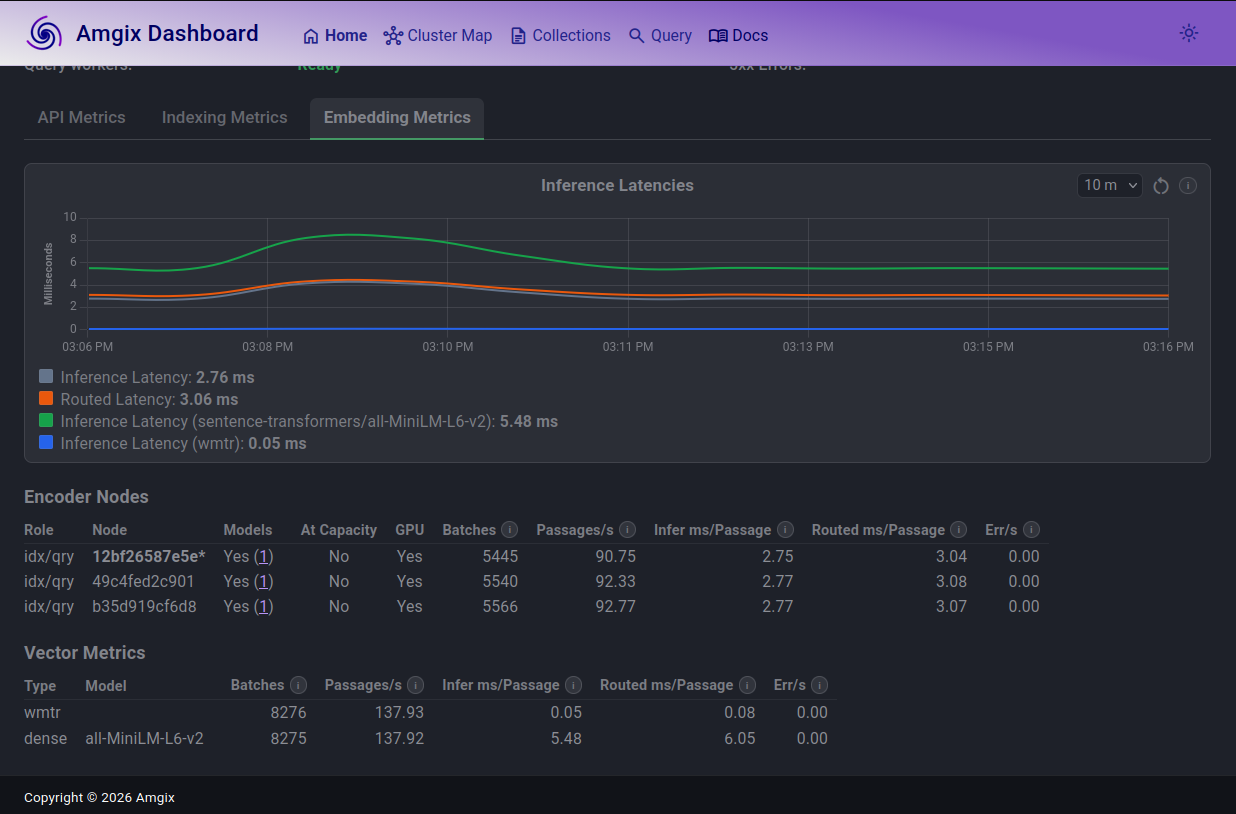
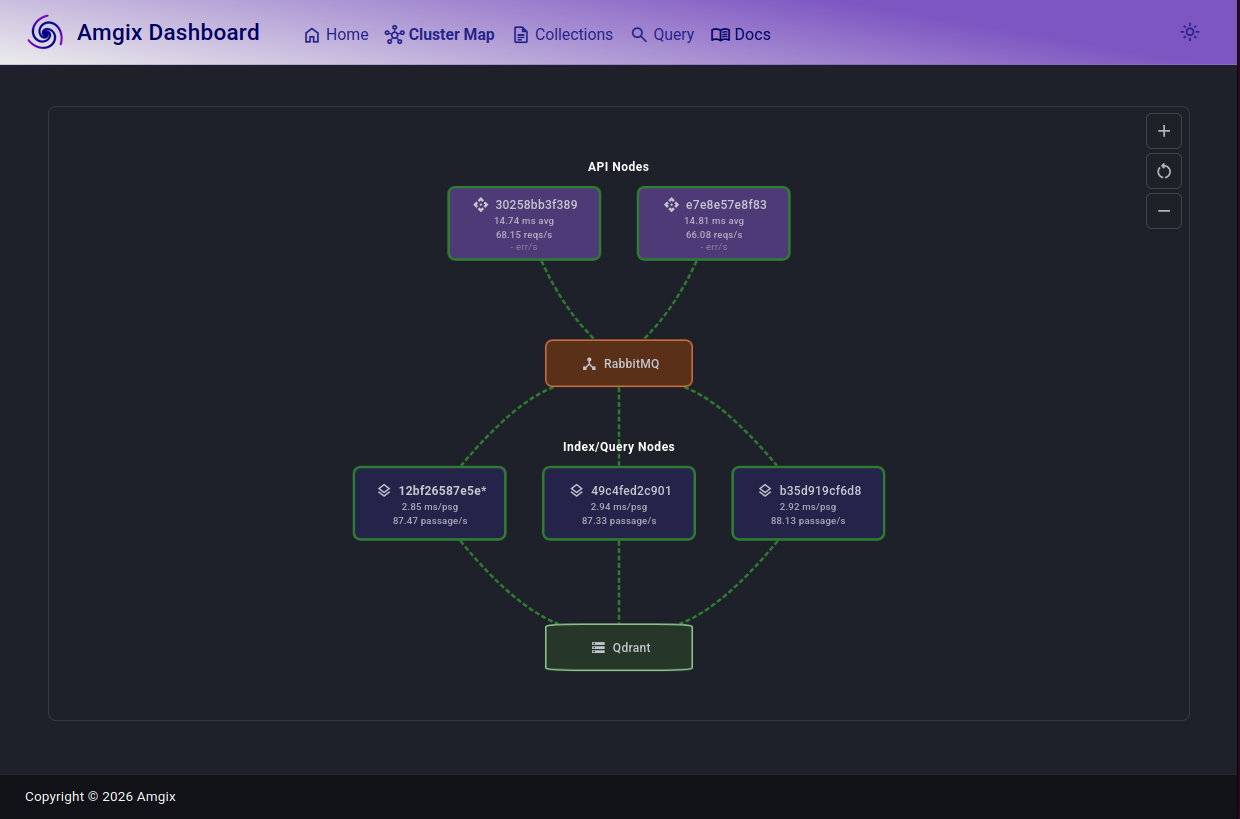
v1.2.0 introduces the Amgix Dashboard, bringing visibility to local vector search. Whether you are running Amgix-One or scaled Amgix cluster, you get immediate view into current metrics and historical trends of API, Indexing, and Embedding. In addition to that, you can see per collection information, manage collections, query your data, and have a dynamic visual representation of the entire cluster with Cluster Map.
See the screenshots below to get an idea of the detailed view of the Amgix cluster you get with the dashboard:
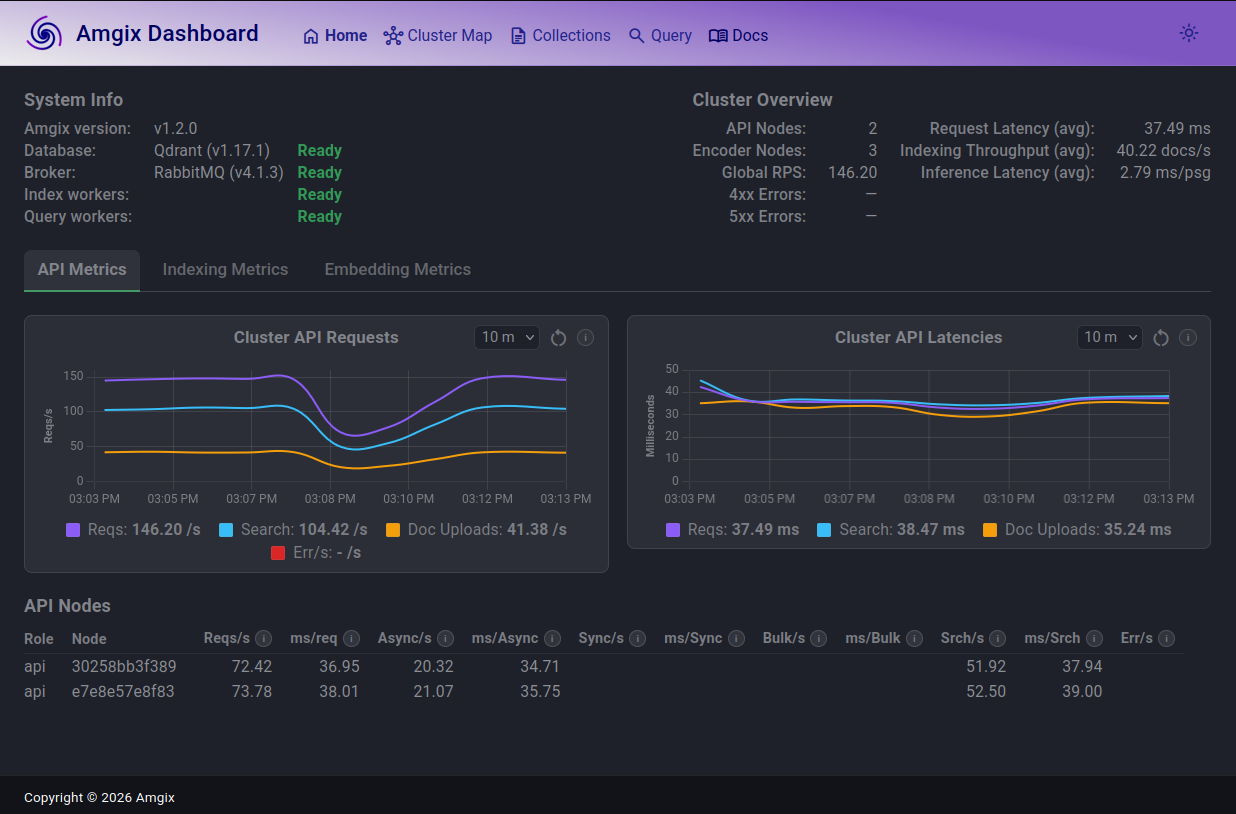
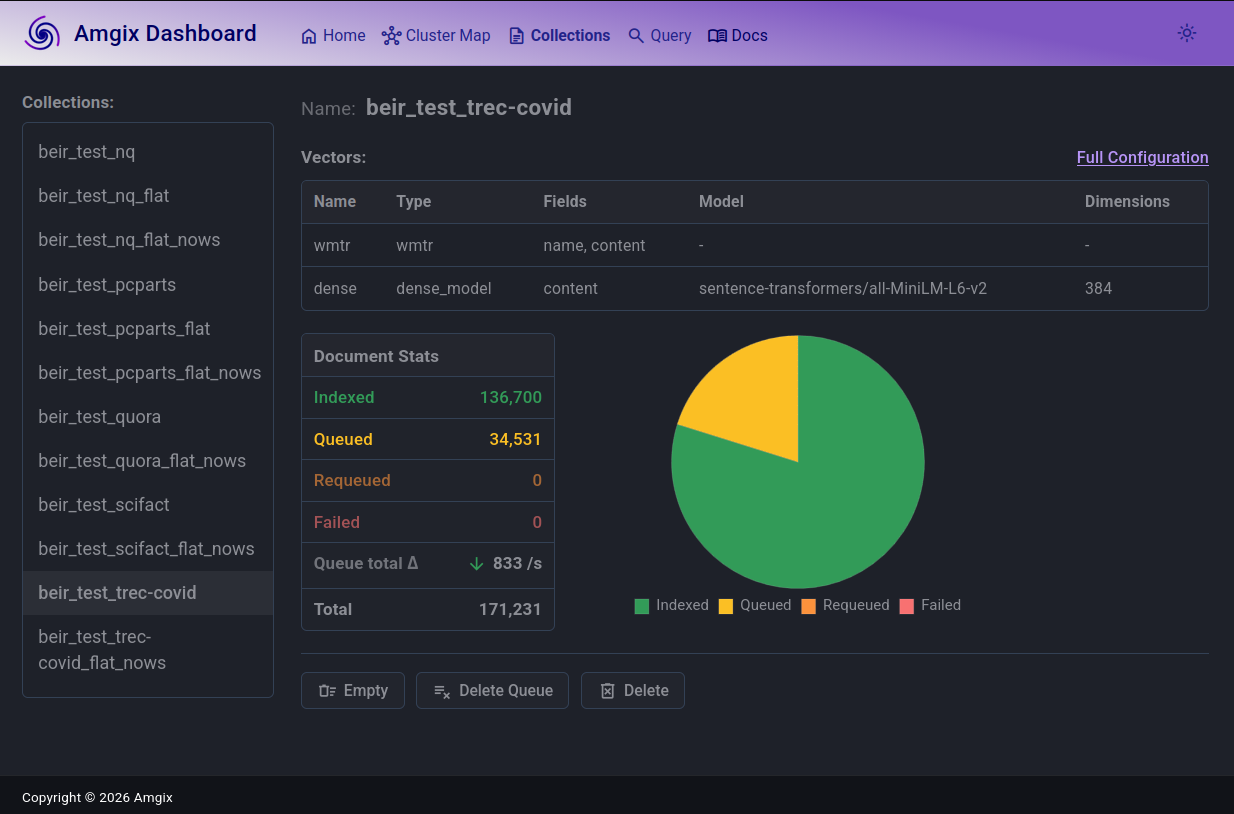
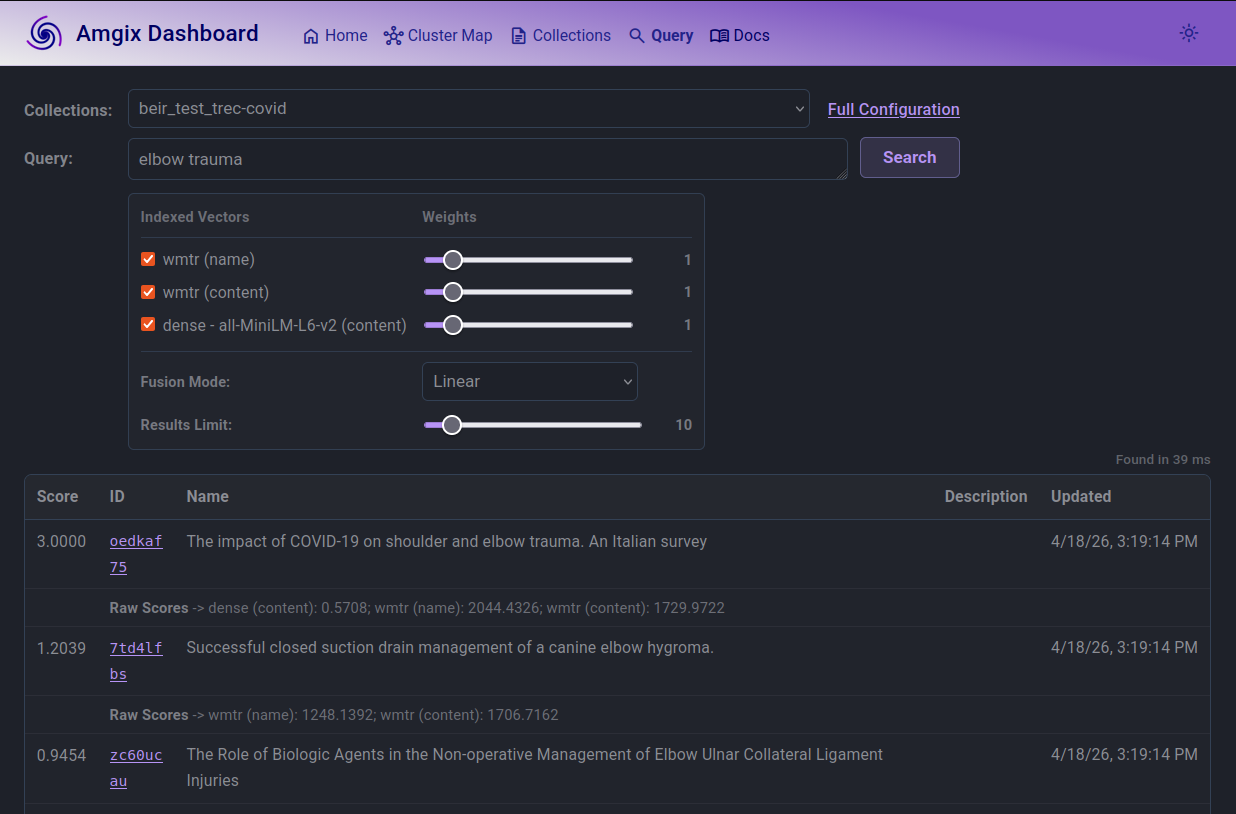
Dashboard is accesible by pointing your browser at /dashboard endpoint of Amgix API.
Metrics
In this release we have redesigned how metrics are collected internally and reported. As the result, we were able to expose metrics via our API. There are four new endpoints that can be used to scrape and observe inner workings of Amgix:
/v1/metrics/currentgives you the current cluster metrics in a sliding window./v1/metrics/trendsreturns historical trends for the cluster metrics in 1-minute resolution for up to 24 hours, and 5-minute resolution for up to 7 days./v1/metrics/prometheusexposes the current metrics in Prometheus format./v1/metrics/definitionslists all the metrics available in the system with information about them.
Conclusion
Amgix v1.2.0 adds the observability layer needed to monitor the cluster without external dependencies. The dashboard and metrics endpoints provide a high-level view of the system, making it easier to see how the system is behaving under load.