Amgix One Under Load: How Much Hybrid Search Can a Single Container Handle?
We designed Amgix One to make deployment simple. It's a great choice if you are just starting out with Amgix, or if you have moderate requirements. But what does "moderate" mean in this context? How much work can Amgix One handle? What sort of performance can you expect from this deployment? And what happens if you push it beyond those limits?
New to Amgix?
Amgix is a distributed hybrid search system. Amgix One is a single-container variant designed for simplicity of deployment. Learn more.
TL;DR
Jump to results:
What is Amgix One
Amgix One is a single-container deployment of Amgix server designed for simplicity of deployment, testing, or any environment where you don't need the full power and scalability of Amgix.
All necessary components to run Amgix server are packaged in a container: an API process, two Encoder processes, a RabbitMQ server, and a Qdrant server.
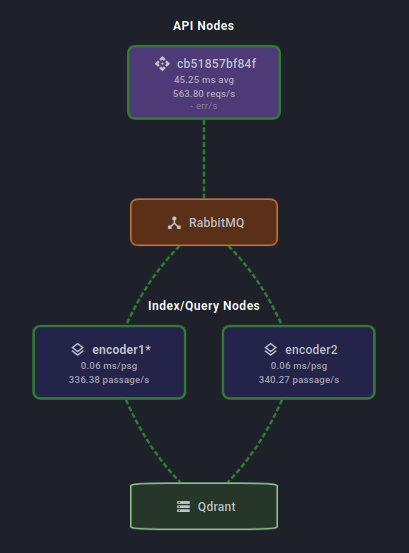
Essentially, it's a mini distributed hybrid search system in a box. You can see the cluster map of Amgix One from the dashboard in the image to the right.
Like any architectural compromise, simplicity comes with a cost. Amgix One is not designed to be scaled out beyond the processes that already packaged with it. This is possible by pointing Amgix One at an external RabbitMQ and backend database (Qdrant/PostgreSQL/MariaDB), but it is not the recommended upgrade path. When you outgrow your Amgix One deployment, you should start looking at switching to a full Amgix server configuration.
The good news is that the transition is easy. Amgix One uses the same API and storage as standard Amgix. So you can simply swap one for the other without making any changes to your application.
Test Setup
Hardware
All tests are performed on a single bare-metal machine with the following specifications:
- CPU: AMD Ryzen™ 9 5900X × 12 cores (24 threads)
- RAM: 64GB
- GPU: NVIDIA GeForce RTX 5060 Ti (16GB)
- Storage: SSD
- OS: Ubuntu 24.04.4 LTS
Note
This is hardly a clean room test setup. It's not even a server. It's a desktop Ubuntu workstation with many other processes running on it at the same time: browser windows, many applications, etc.
Methodology
Test Harness and Workload
We used Locust with 8 workers to simulate the load. All tests are performed against a single collection of documents in Amgix.
- A set of 100,000 sequential document IDs is generated at the start of the test.
- Every document has
nameandcontentfields. nameis a string of up to 10 random words generated by Python's Faker library:Faker().sentence(10)contentis a string of 5 short random paragraphs generated by Faker:'\n\n'.join(Faker().paragraphs(5))- search queries are up to 5 random words generated by Faker:
Faker().sentence(5) -
Each Locust user executes the following 3 requests:
- search: random query, top 10 results, all defaults (RRF fusion, all vectors, weights of 1.0)
- upsert: pick random doc ID, generate random
nameandcontent, call async upsert endpoint. Random doc IDs create either a new document or updates an existing one, depending on whether the ID is already in the collection. - delete: pick random doc ID, call async delete endpoint.
-
The split of requests for each user is: 80% search, 19% upserts, 1% deletes. This generates a somewhat believable workload where most of the time users are searching, sometimes update documents, and very occasionaly delete them.
- The Amgix collections were pre-populated by previous test runs to about 80,000 documents. Because tests, both insert and delete documents randomly, the actual number of documents in the collection changes during the tests.
- Locust users do not have any artificial delays, they execute queries as fast as possible. This is a stress test. With this in mind, the number of Locust users in result tables below do not represent the number of active users the system can sustain. For the discussion on estimating active users please see Estimated Active Users in Measurments section below.
Note
All of the documents and queries are random. This defeats some of the caching in the backend database, and makes it a more difficult test case than what a real-world application usage patterns will likely present.
Amgix One Configuration
We used Amgix One v1.3.5 (the latest at the moment of writing) for all the tests.
Keyword Search Collection
For keyword searches we configured the collection with two (2) WMTR vectors: on name and content.
CollectionConfig(
    vectors=[
        VectorConfig(name="wmtr", type="wmtr", index_fields=["name","content"]),
    ],
)
Amgix One was started with this command:
docker run -d \
    -v <path-to-data>:/data \
    -p 8234:8234 \
    --cpus 4 \
    amgixio/amgix-one:v1.3.5
Hybrid Search Collection
For both CPU and GPU hybrid searches we configured the collection with two (2) WMTR vectors (name, content) and a dense vector on content with a small model (sentence-transformers/all-MiniLM-L6-v2).
CollectionConfig(
    vectors=[
        VectorConfig(name="wmtr", type="wmtr", index_fields=["name","content"]),
        VectorConfig(
            name="dense",
            type="dense_model",
            model="sentence-transformers/all-MiniLM-L6-v2",
            index_fields=["content"],
        ),
    ],
)
For CPU version of hybrid we used the same startup command as for the keyword-only search (see above). For GPU tests, Amgix One GPU variant was started like this:
docker run -d \
    -v <path-to-data>:/data \
    -p 8234:8234 \
    --cpus 4 \
    --gpus all \
    -e AMGIX_ONE_ENCODER_MODELS=2 \
    amgixio/amgix-one:v1.3.5-gpu
Operational Constraints
The only hardware limitation we imposed on Amgix One container is limiting it to 4 CPU cores in all tests. We intentionally did not limit the memory, to observe how much RAM it will consume on various tasks.
Goals
We had three goals:
- measure and record the system metrics at different levels of load.
- find the maximum level of load the system can sustain while maintaining the
p50latency under 100ms. - observe and report what happens to the system when it is pushed beyond the stable state.
Measurements
All the tests were executed by the following procedure:
- ramp up the number of users to the desired level.
- let the system settle for a minute.
- reset Locust statistics.
- wait for a couple of minutes.
- record the numbers.
Here are the metrics we have recorded:
Locust Users: this was our only toggle - we set this number to the desired value to observe the resultsRPS: number of all requests per second as reported by Locustp50: median search latency in milliseconds as reported by Locustp95: 95 percentile of search latency in milliseconds as reported by Locustp99: 99 percentile of search latency in milliseconds as reported by LocustCPU %: CPU utilization as reported bydocker statsRAM (GB): memory usage by the container as reported bydocker stats
To find the maximum number of Locust users the system can sustain we've used the following criteria:
p50latency must be below 100ms.- search and document queues are stable (not growing uncontrollably).
- the system appears stable and sustaining the state for at least 10 minutes.
Estimated Active Users
In the result tables below we have included an estimated active users column for an imaginary application.
These numbers are calculated based on RPS recorded at a particular load and an assumption that a hypothetical user of the application searches/saves/deletes about every 30 seconds. We believe this number is actually pretty conservative. For a typical user to perform one of these operations every 30 seconds at a sustained rate is probably unrealistic.
We are displaying those numbers to contrast the number of Locust Users we record, that are hammering the system as fast as inhumanly possible, to what the actual real-world usage of your application may be to generate this level of load.
With that said, these numbers are guesstimates and provided simply as possible frame of reference. The actual number of active users required to generate comparable RPS varies wildly and depends completely on the application specifics and typical user behavior in the particular system.
What Amgix One does Under the Hood
To fully appreciate the results below it's important to understand what is happening under the hood of Amgix One when we apply the test workload. The important point is that Amgix doesn't just search with provided vectors, it works with raw texts (query or document) and does: queueing, embedding, distributed locking, deduplication, collection stats tracking, metrics accumulation, fusion, and ranking of the results. Here is the breakdown of the steps by endpoints we call:
Upsert
When asynchronous upsert endpoint is called Amgix performs the following steps:
- API stores the document in the internal queue, sends RabbitMQ message to notify index nodes, and returns success to caller.
- Index node picks up a message, takes distributed lock, performs deduplication logic, computes vectors from document texts, stores them in the database, cleans up the queue, and updates the collection stats.
Search
Search path looks like this:
- API node makes an RPC call to Query worker
- Query worker vectorizes the query text into 1-2 vectors (1 for keyword search, 2 for hybrid searches), executes database search, fuses and ranks the results, and ships the results back to the API worker.
Delete
- API stores the document in the internal queue, sends RabbitMQ message to notify index nodes, and returns success to caller.
- Index node picks up a message, takes distributed lock, removes the document, clears any queued upserts for the same document that are older than this delete request to prevent them from re-creating it, and updates the collection stats.
Results
Keyword Search
Keyword workload uses two (2) WMTR vectors to search and upsert documents. WMTR is not a model based algorithm, it's a custom Amgix lexical tokenizer, written in Rust. See WMTR relevance benchmarks and a follow up fusion discussion. Because WMTR is lightweight, it produced the best load results out of the three configurations we've tested for this report.
| Locust Users | RPS | Est. Act. Users* | p50 (ms) | p95 (ms) | p99 (ms) | CPU % | RAM (GB) |
|---|---|---|---|---|---|---|---|
| 5 | 15 | 450 | 13 | 15 | 17 | 26 | 0.6 |
| 10 | 31 | 930 | 12 | 15 | 19 | 40 | 0.5 |
| 20 | 61 | 1830 | 13 | 16 | 19 | 85 | 0.6 |
| 100 | 296 | 8880 | 27 | 73 | 160 | 280 | 0.7 |
| 200 | 539 | 16170 | 46 | 170 | 370 | 380 | 1.2 |
| 225 | 550 | 16500 | 86 | 220 | 460 | 400 | 0.9 |
| 300 | 590 | 17700 | 210 | 360 | 500 | 400 | 1.0 |
Est. Act. Usersnumbers are guesstimates based on a calculation. See Estimated Active Users.
Observations
Search latencies stay very low for up to 100 Locust users. Then, as loads increased and we began approaching CPU saturation, the tail latencies began to separate. The maximum number of Locust users we were able to sustain while staying under 100ms p50 was 225. Memory utilization is below or around 1GB with some fluctuations. CPU, predictably, maxed out at around the 225 user level. Below are some observations of what happens when we increase the loads even further:
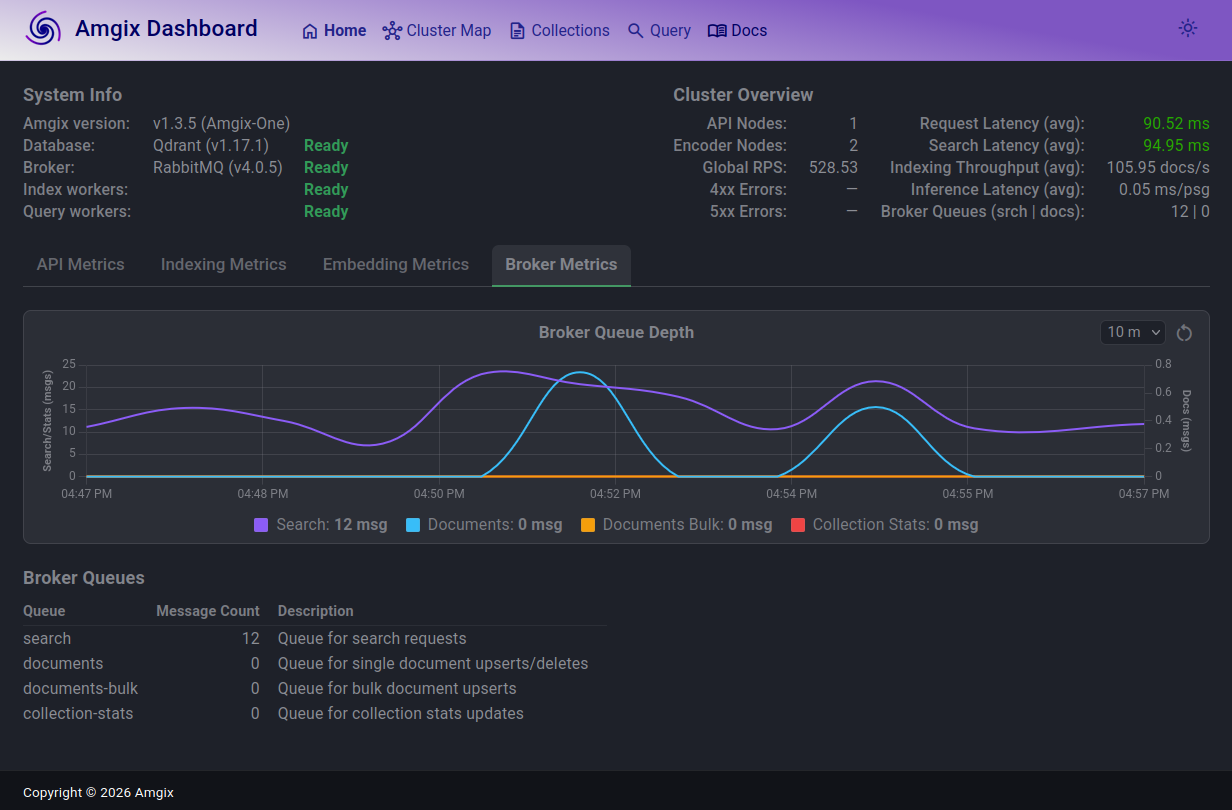
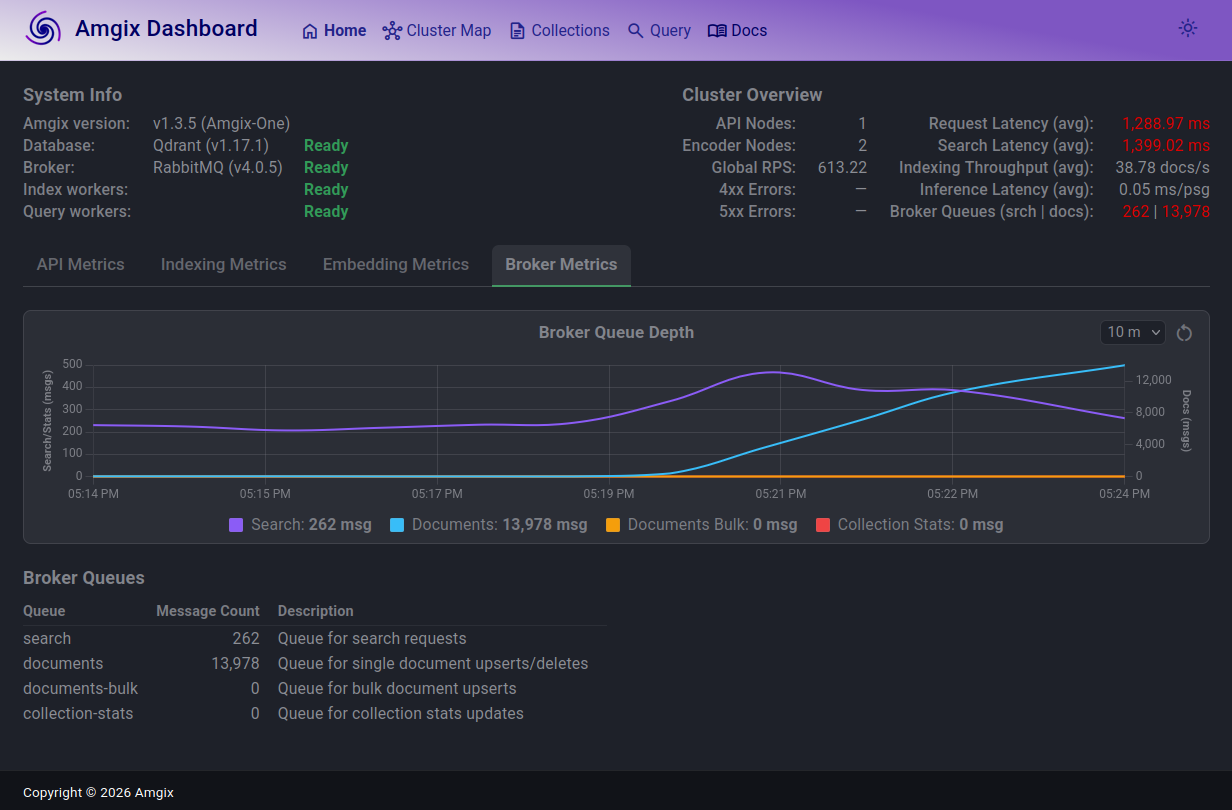
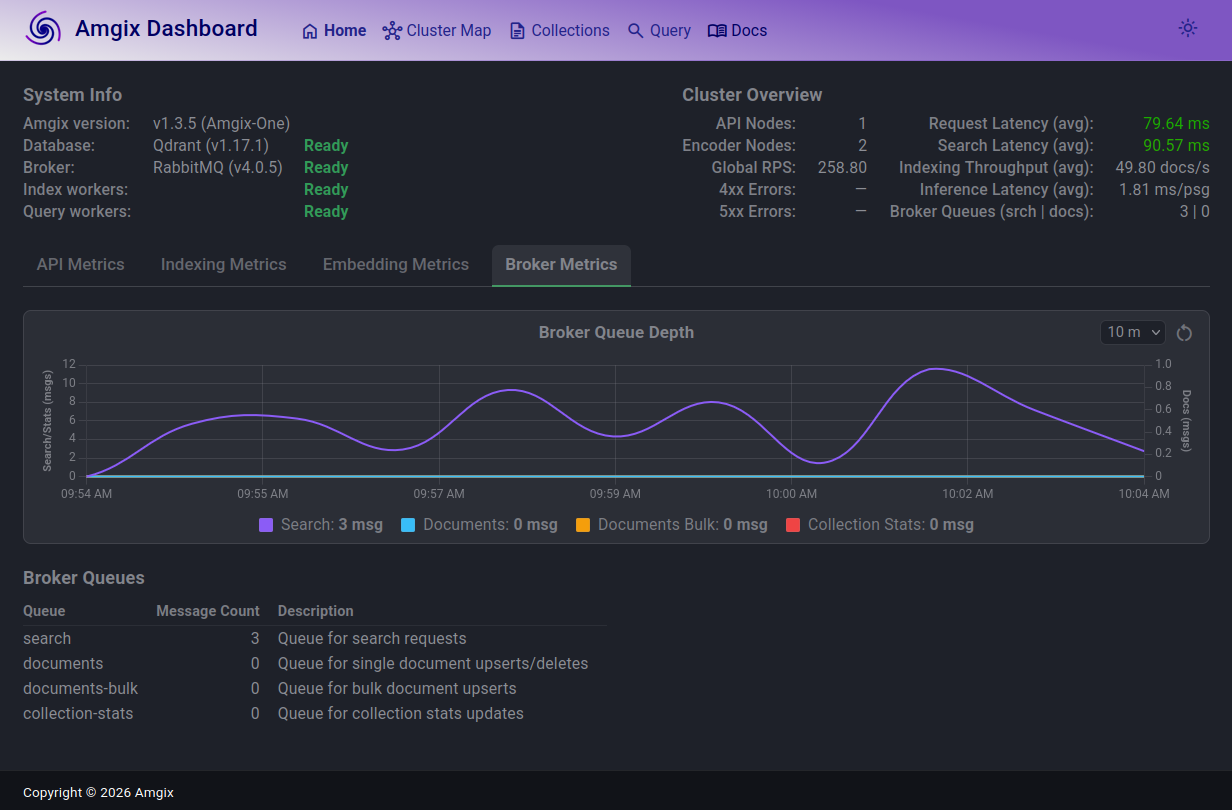
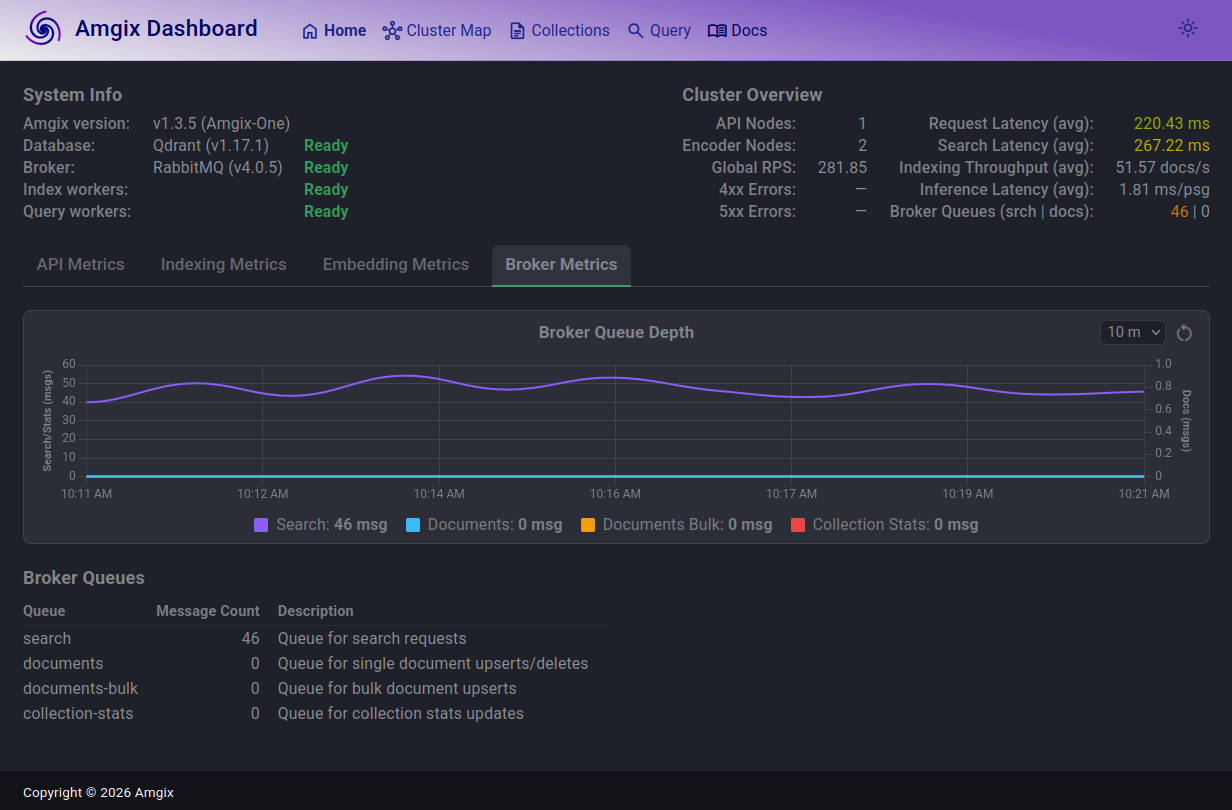
In this screenshot, taken at the load of 225 Locust users, you can see that the search queue depth (purple line) is elevated, it fluctuates slightly over the last 10 minutes, but it's steady. On average, it's not growing over time. Some search requests are queued briefly and processed. p50 search latencies stay under 100ms. Document queue (teal line) spikes a bit from time to time, but largely is drained as fast as documents arrive. Here, we are riding the edge of all 4 CPUs being saturated, but the system is performing well.
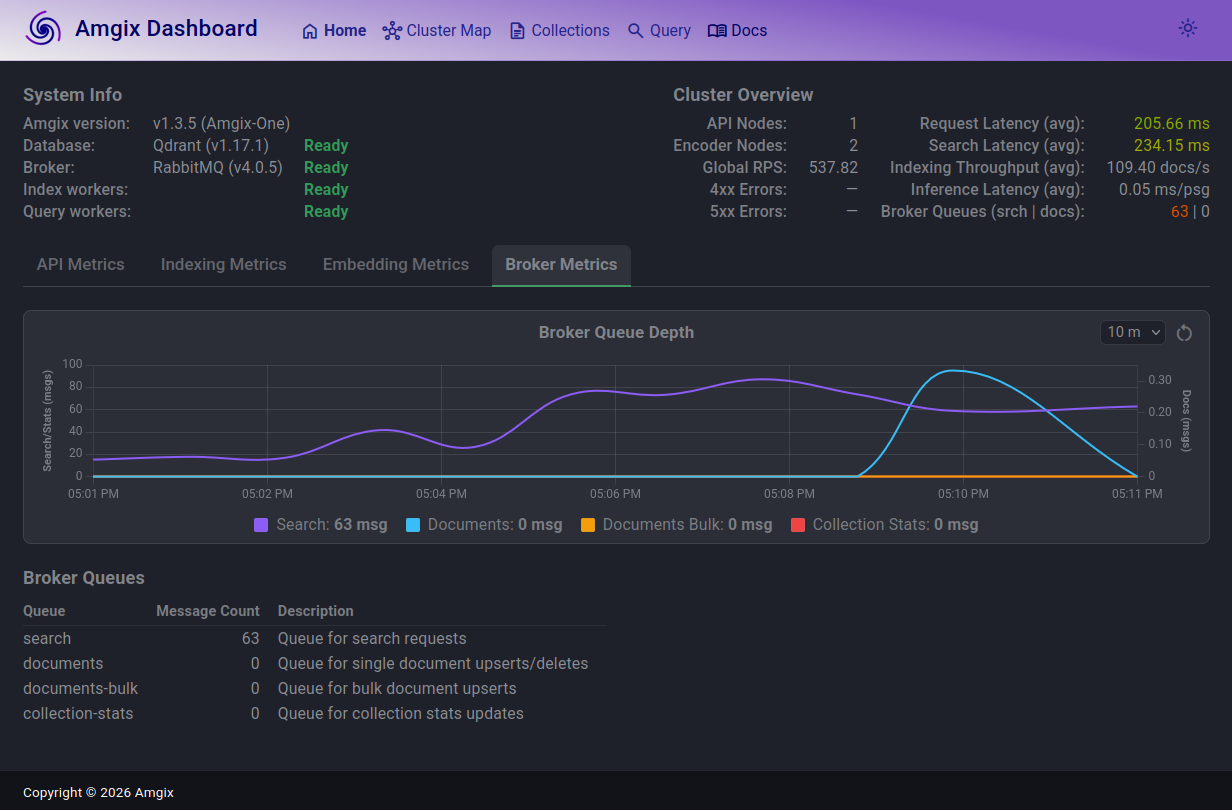
At 300 Locust users the search queue grew, search latencies are now over 200ms, which is still barely noticeable to end users. But the system seems to come to an equilibrium. The queues are not growing, search requests are still fairly fast and there are no errors.
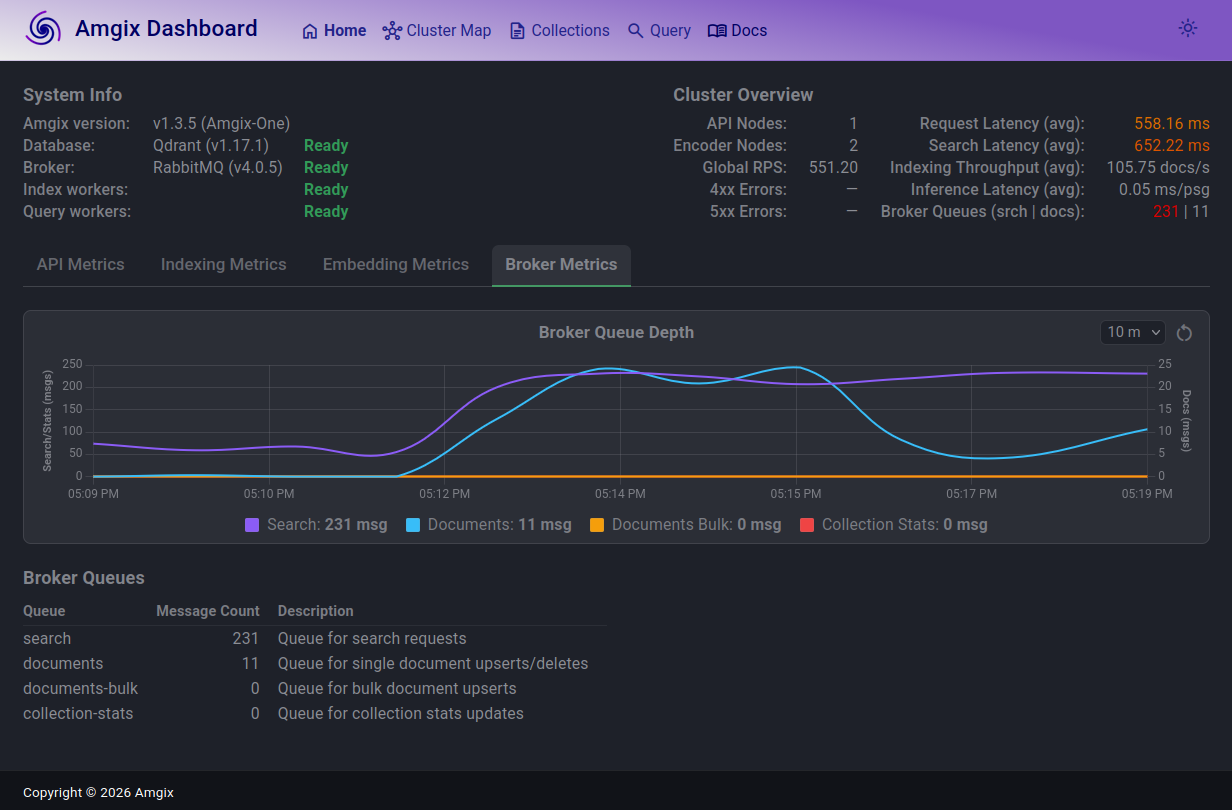
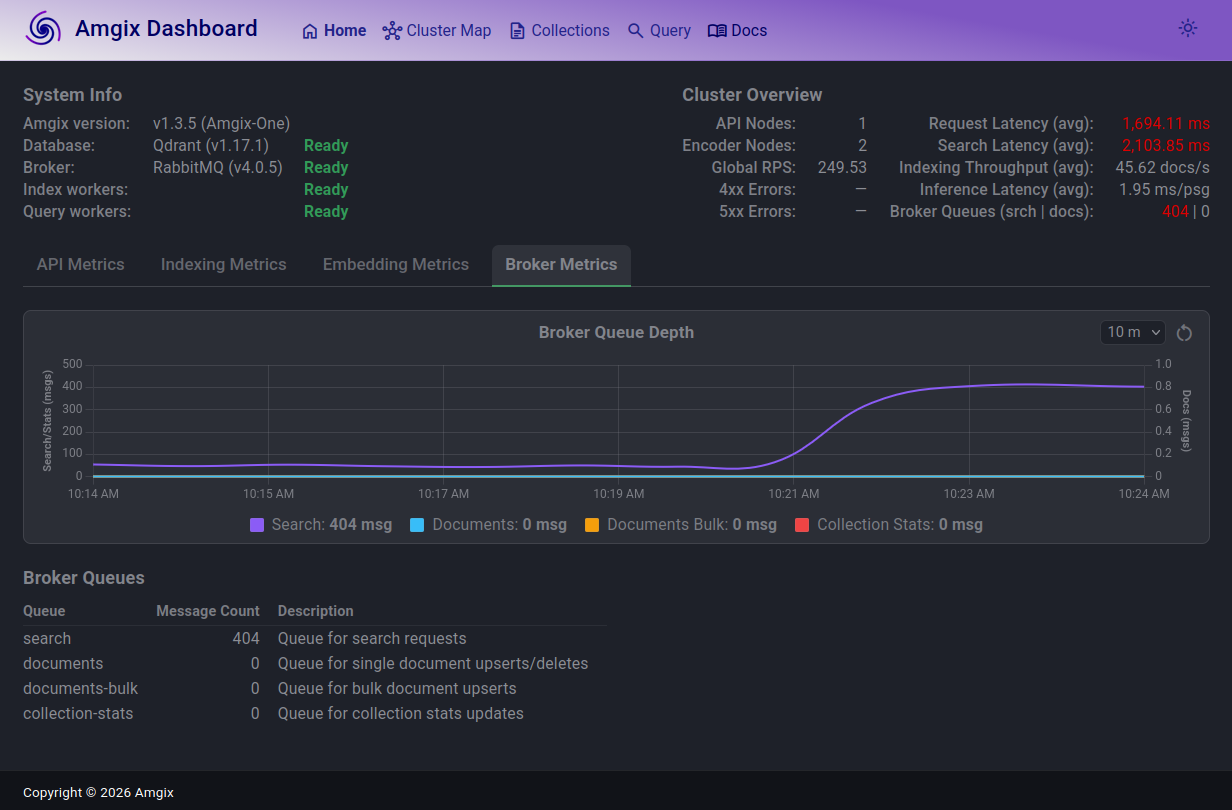
When we push to 500 users, the story repeats. The search queue is now in low hundreds, search latencies are over 600ms, inching into uncomfortable territory. Document queue grew, but then almost drained and continues to fluctuate. And, once again, the system finds its stride and settles into this new state. No errors.
1000 users. The story changes. Search latencies are now above 1.3s (not great!). Search queue largely in the same ballpark as with 500 users and fluctuates, but not growing. RPS saturated around 600.
Documents queue is where things are not looking healthy. The queue is growing and is not coming down. At the time of the screenshot, there are over 13K documents unprocessed in the queue. Document ingestion path is unable to keep up with the load anymore. If this level of load continues for some time, the system may start hitting the hard limits of messages in Rabbit queue and will begin returning errors on document upserts.
How soon we will arrive at a hard wall depends on a lot of factors. Amgix has a hard limit of 500,000 messages in the queue. Provided everything else holds, and if (judging by the screenshot) we are growing documents queue at the rate of 13,000 documents in 3 minutes, we are probably looking at about 115 minutes of this sustained load before we will start seeing API errors.
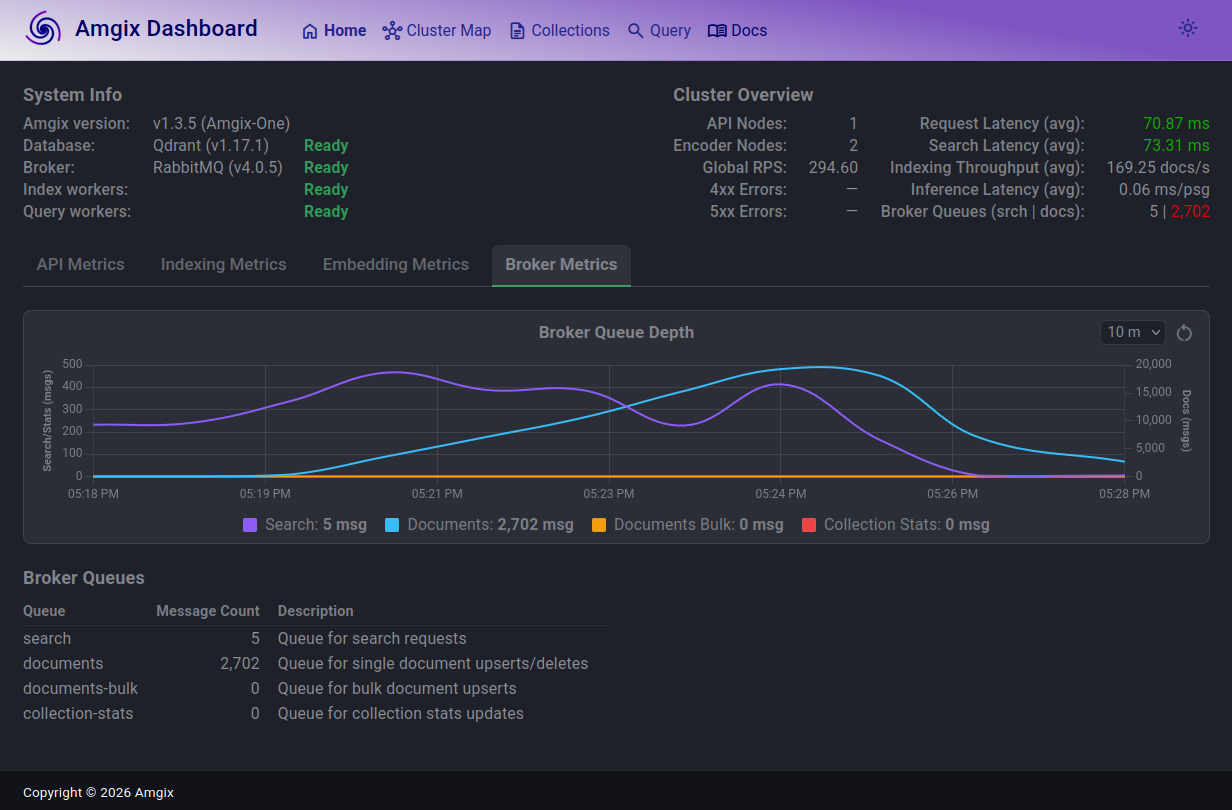
This next screenshot is what happened when we reduced the load back down to 100 Locust users. Within a minute search queue drained and search latencies returned back to under 100ms. Documents queue continues to drain rapidly and will be back to normal in minutes. The system is back to a healthy steady state.
Hybrid Search with CPU
Hybrid Search with CPU utilizes 3-vectors collection with WMTR on name and content fields, and dense model on content.
| Locust Users | RPS | Est. Act. Users* | p50 (ms) | p95 (ms) | p99 (ms) | CPU % | RAM (GB) |
|---|---|---|---|---|---|---|---|
| 5 | 14 | 420 | 35 | 97 | 190 | 275 | 1.0 |
| 10 | 27 | 810 | 56 | 170 | 210 | 375 | 1.0 |
| 12 | 30 | 900 | 94 | 210 | 290 | 400 | 1.0 |
| 20 | 34 | 1020 | 290 | 680 | 770 | 400 | 1.0 |
Est. Act. Usersnumbers are guesstimates based on a calculation. See Estimated Active Users.
Observations
Just like with Keyword tests we hit optimal number of Locust users with p50 for search latencies under 100ms as the CPU cores saturate. But unlike the Keyword tests, we hit the CPU ceiling at much lower number of 12 Locust users and RPS saturated at about 34-35. As we experimented with higher and higher number of Locust users, the story turned out to be much more about inference latencies than about the search and documents queues:
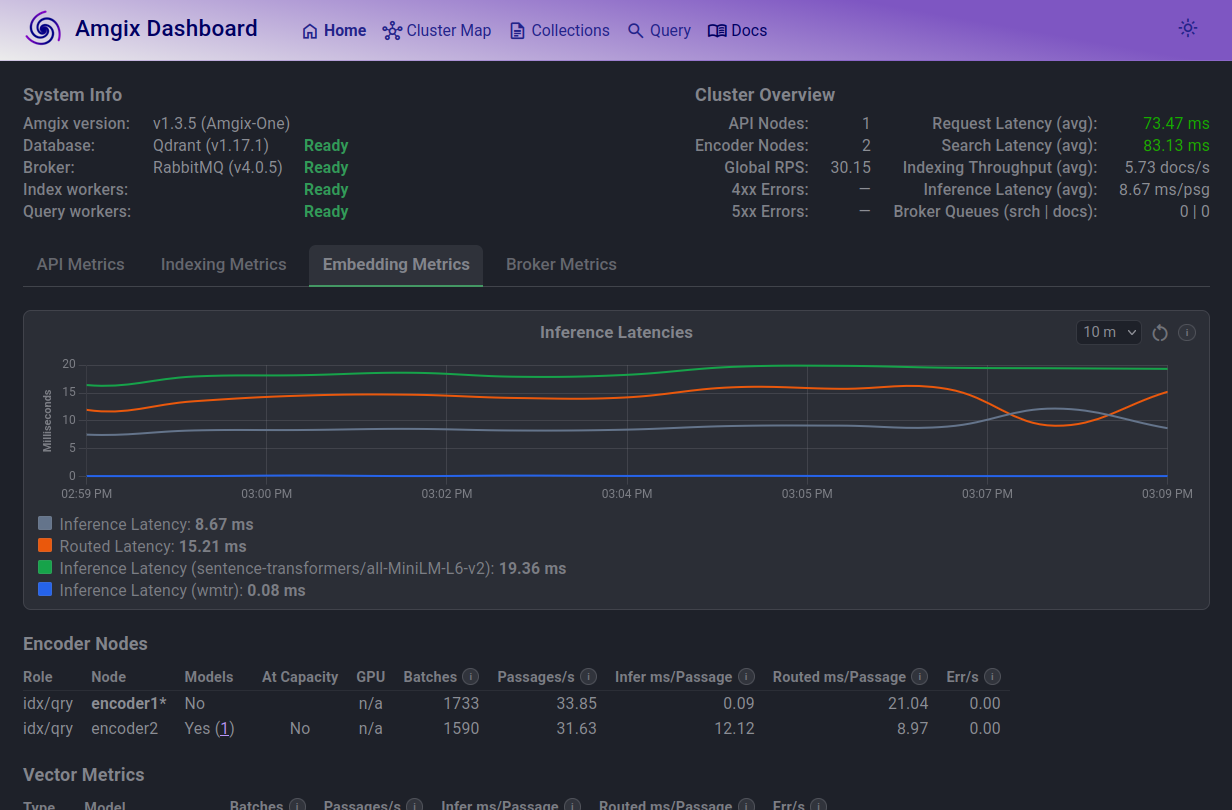
Looking at inference latencies graph at 12 Locust users, things are predictable. Model inference (green line) is the slowest.
But if you look at the Encoder Nodes table, you will notice a couple of things:
- only one encoder is allowed to load the model (this is the default in Amgix One)
- routed latency on that node is much higher. Routed inference latency includes the time for roundtrip RPC calls encoder1 has to make to encoder2 to embed its documents/queries. This extra work is what drags the search latencies up.
In a separate set of tests we have experimented with allowing both encoders to load models. You can do this by setting AMGIX_ONE_ENCODER_MODELS environment variable to '2' on the container's start up. However, we found that this configuration reduces performance with CPU model inference. Both encoders compete for the same limited CPU cycles.
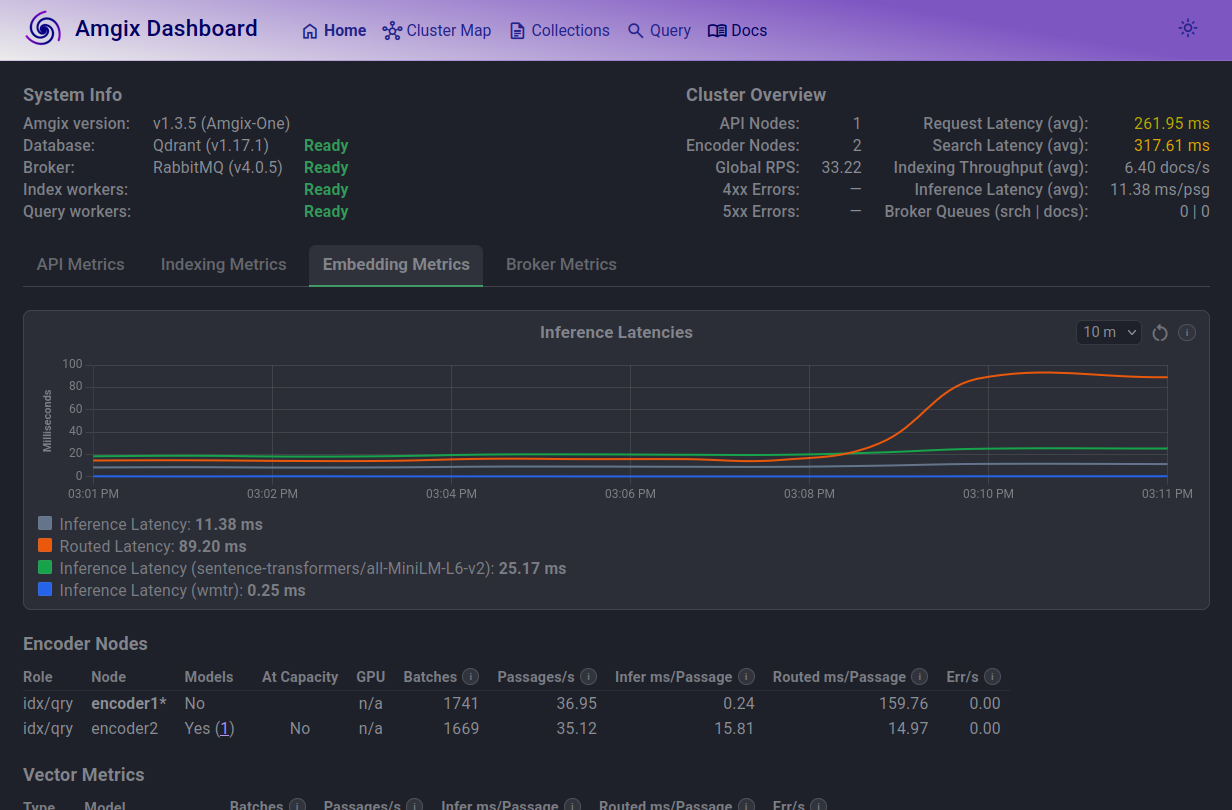
At 20 Locust users, you can see how the average routed latencies (orange line) is what takes the hit. CPU cores are saturated and RPC calls take more time.
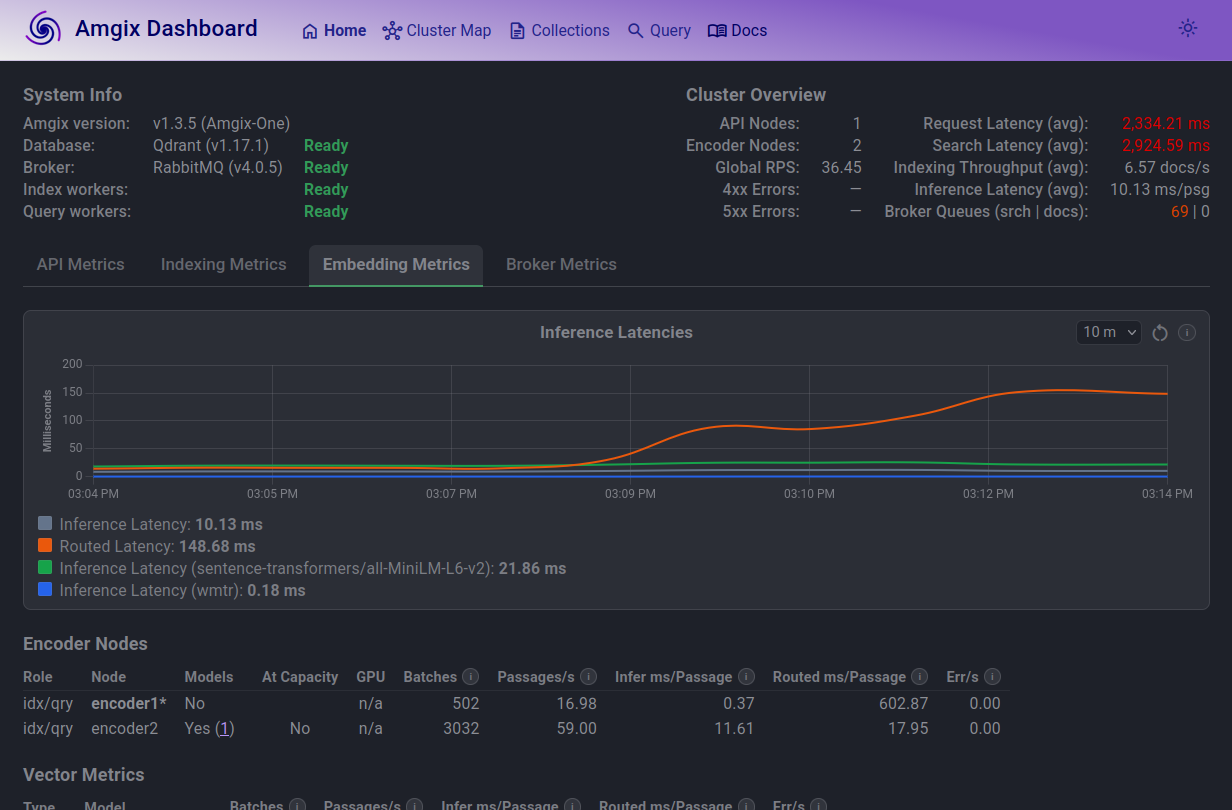
At 100 Locust users, the trend continues. On average, a text passage on encoder1 has to wait for over 600ms to get embedded. Search queue is elevated. Average search latencies are just under 3 seconds.
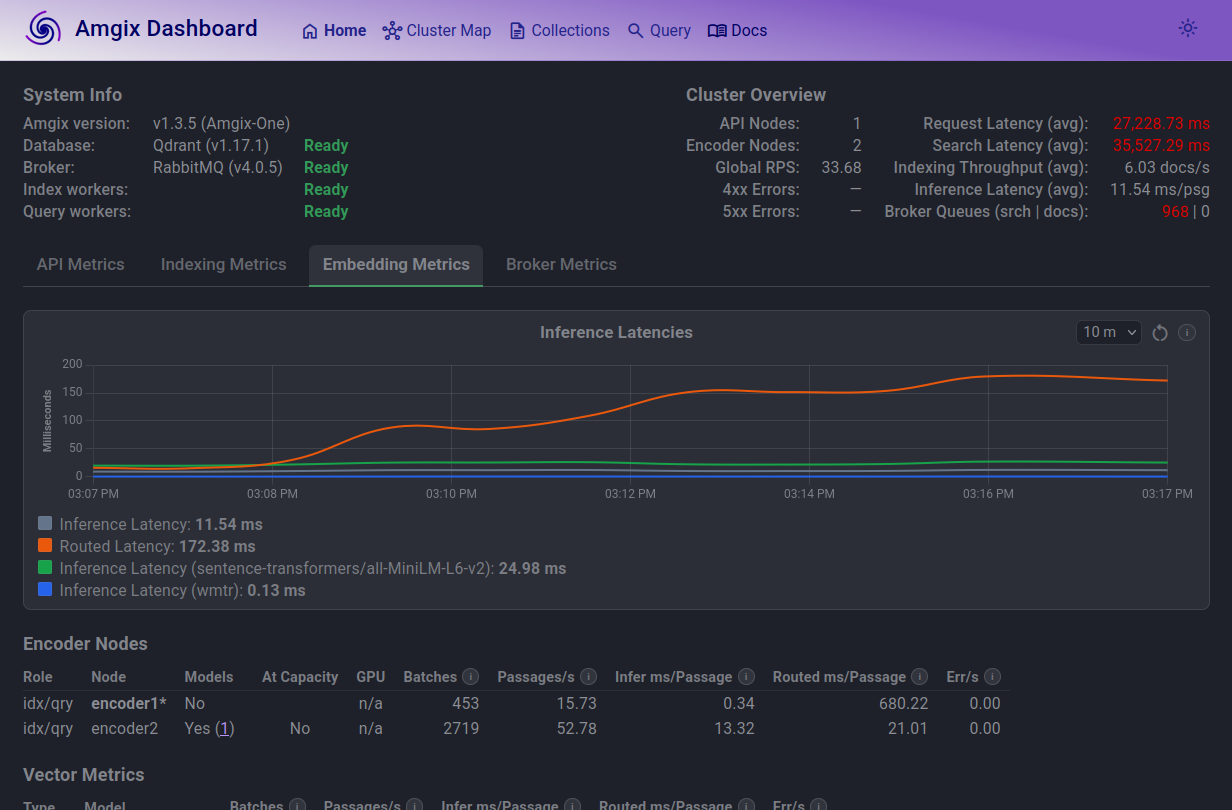
At 1000 Locust users, situation deteriorates. Average search now takes longer than 30 seconds, which is totally unacceptable.
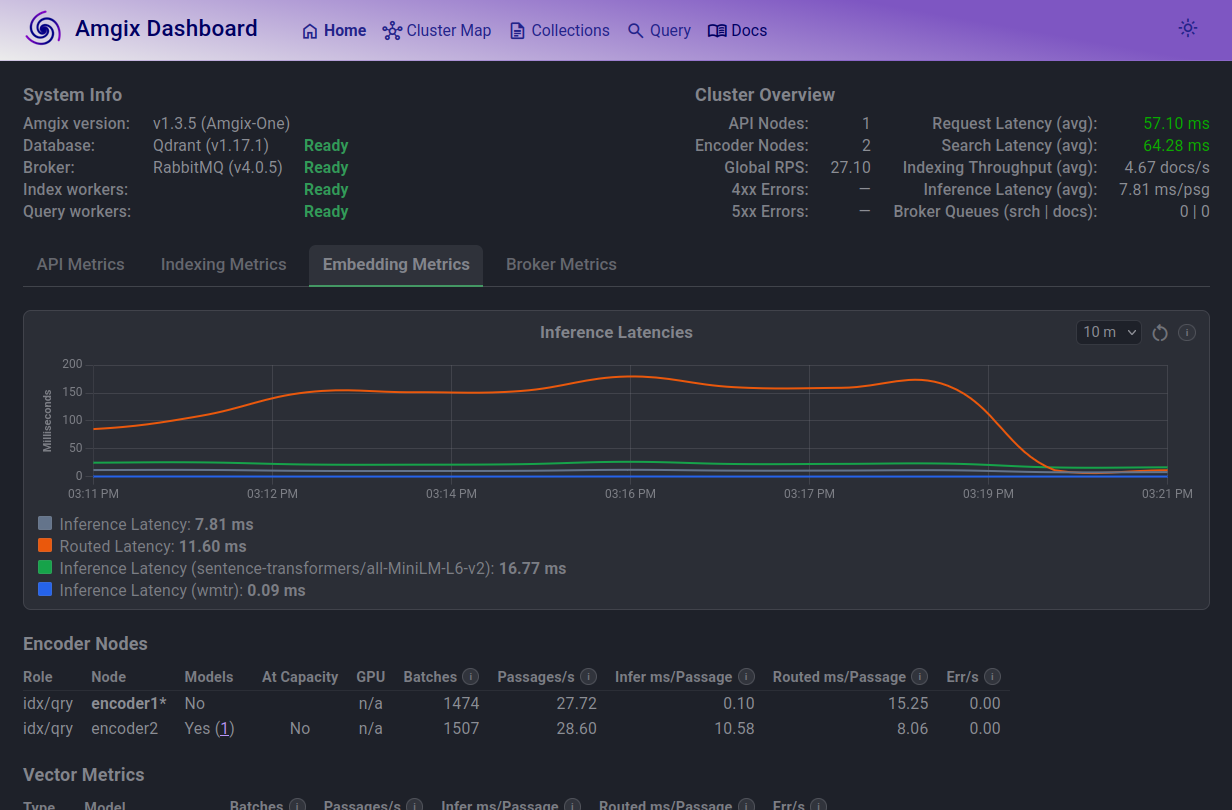
Bringing the load back down to 10 Locust users results in the system quickly catching up with the search queue. Search latencies and routed inference latencies return to normal.
Hybrid Search with GPU
This is the same 3-vectors collection (with WMTR on name and content fields; dense model on content) as the Hybrid Search with CPU. The only differences are: Amgix One utilizes GPU and both encoders are configured (via AMGIX_ONE_ENCODER_MODELS environment variable) to load models.
| Locust Users | RPS | Est. Act. Users* | p50 (ms) | p95 (ms) | p99 (ms) | CPU % | RAM (GB) |
|---|---|---|---|---|---|---|---|
| 5 | 15 | 450 | 28 | 37 | 44 | 40 | 2.6 |
| 10 | 30 | 900 | 29 | 42 | 51 | 70 | 2.6 |
| 20 | 59 | 1770 | 31 | 48 | 63 | 140 | 2.6 |
| 50 | 147 | 4410 | 30 | 54 | 110 | 220 | 2.7 |
| 100 | 267 | 8010 | 72 | 140 | 230 | 360 | 2.9 |
| 105 | 275 | 8250 | 80 | 150 | 220 | 375 | 3.1 |
| 150 | 281 | 8430 | 260 | 370 | 500 | 385 | 3.3 |
Est. Act. Usersnumbers are guesstimates based on a calculation. See Estimated Active Users.
Observations
The maximum number of Locust users this configuration can comfortably sustain at below 100ms p50 search latencies is 105. It's much higher than Hybrid Search with CPU, which is expected. Maximum observed RPS saturated at around 281-282.
4 CPU cores never seem to fully saturate in this configuration, even when we threw extra numbers of Locust users at the system. The bottleneck in this configuration is not the CPU cores. GPU utilization was also in low 30%. This suggests that the bottleneck is something else. Upon further testing we believe this is due to the encoder processes being single-threaded. Each encoder process can consume at most one CPU core, so two encoders in Amgix One are limited to 200% CPU utilization regardless of available cores. We simply hit a limit of throughput of two encoders in Amgix One.
We had to work pretty hard to try to find a breaking point of this configuration. We gave up at 10,000 Locust users. Flip through the tabs below to view the screenshots and see our notes:
At 105 Locust users, search queue is slightly elevated but stable. Amgix One is comfortably delivering sub 100ms performance.
At 150 users, the search queue grew to 40-50 range, but is also stable. Average latencies are now in 260ms range.
At this load, the search queue is now substantial (400) and average latencies are over 2 seconds.
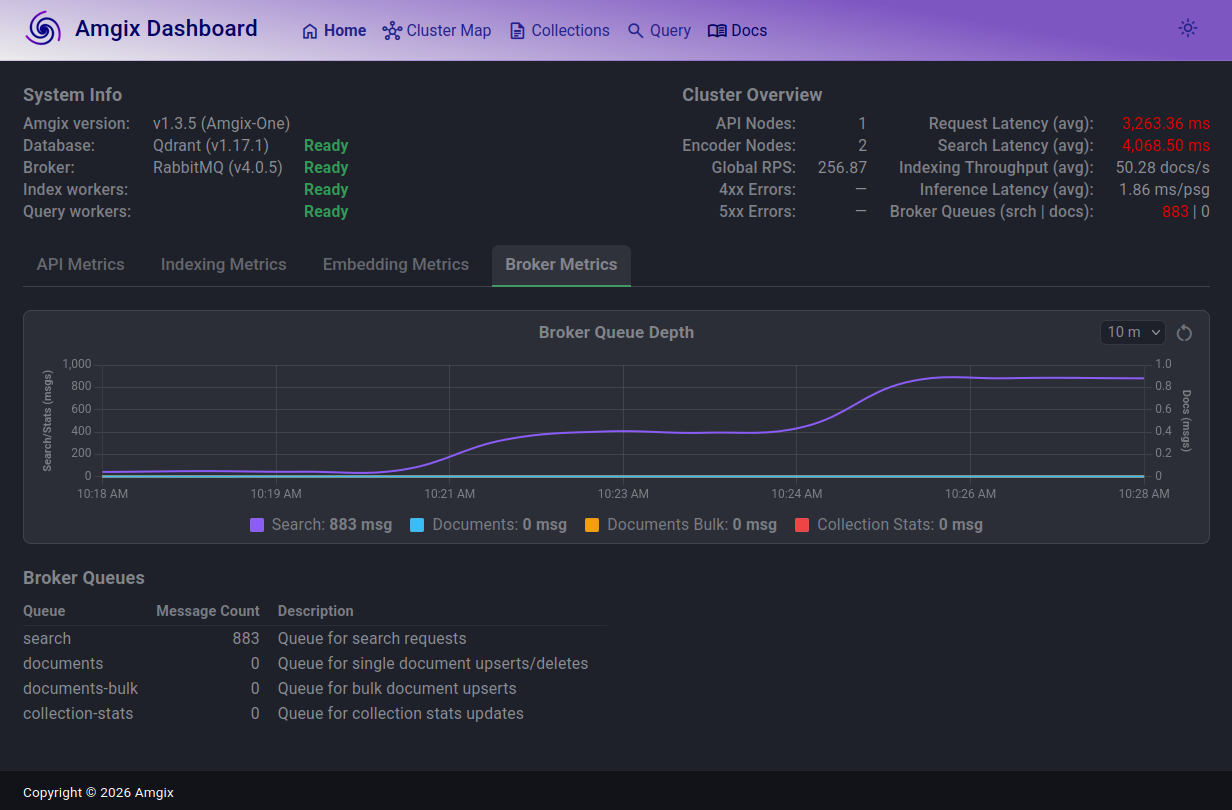
Search latencies are over 4 seconds with the search queue doubling in depth to just under 900.
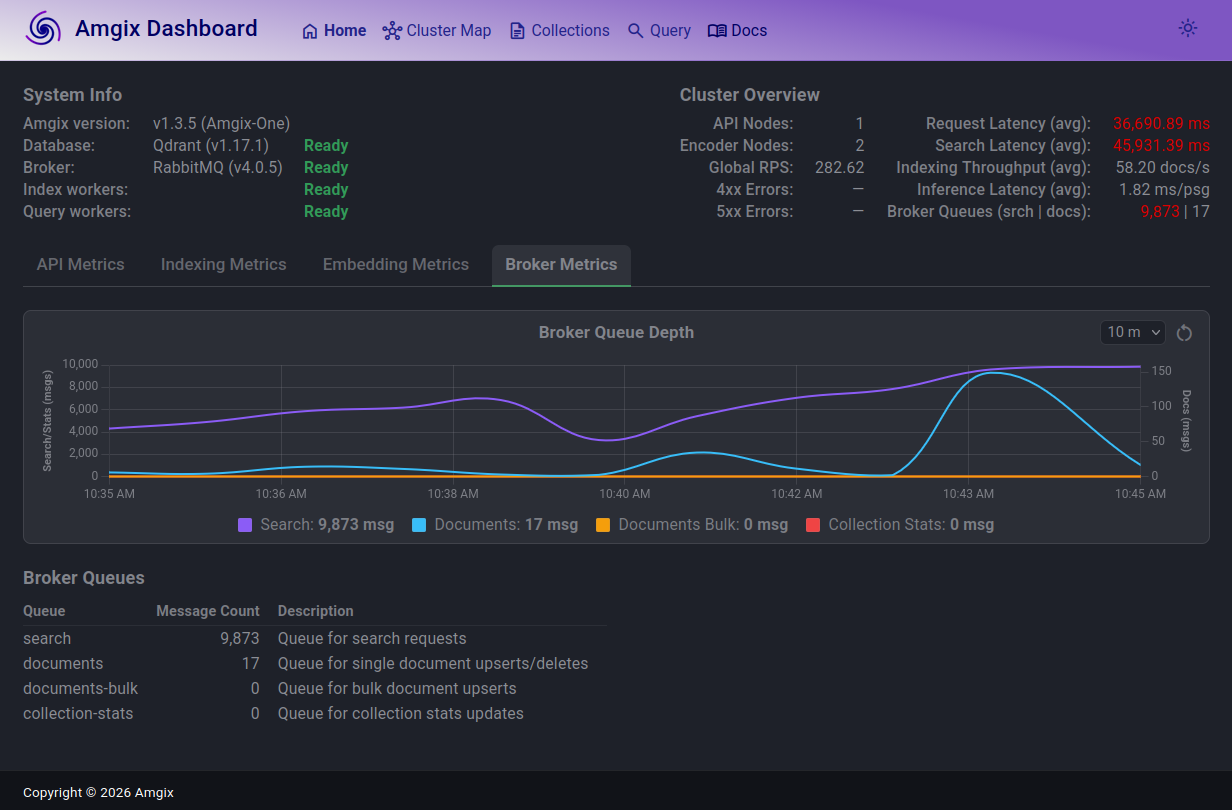
We continued to increase Locust user count by a thousand at a time, expecting the documents queue to start acting up. The system held steady up to around 10,000 users. Documents queue depth jumped up and down a bit, but drained. The search latencies (with queue depth of almost 10,000) are over 45 seconds.
At this load and with these slow search responses, we've observed a couple of search timeout errors. The only 2 errors we have observed in the entire report.
Clearly, the system is basically unusable to the search users at this point. However, the ingestion path seemed to be just fine, happily accepting and processing all the upserts and deletes we were throwing at it.
Conclusion
We set out to answer a simple question: what does "moderate" mean for Amgix One? After days of stress testing, we have a pretty clear answer - and it depends on which configuration you run.
If you don't need semantic search, Keyword Search with WMTR delivers the highest throughput of the three configurations. On 4 CPU cores with no GPU, Amgix One handles thousands of estimated active users at sub-100ms latencies.
If you need semantic hybrid search without a GPU, you can still run it. With an estimated 900 active users at comfortable latencies, this is a legitimate production configuration. Many real applications will never need more. It's also a natural starting point for teams evaluating hybrid search before investing in GPU hardware.
If you have a GPU, Amgix One becomes significantly more capable. At 105 Locust users and sub-100ms latencies, it covers a substantial real-world user base from a single container. The bottleneck here is architectural - two single-threaded encoder processes sharing 4 cores with everything else.
Beyond the limits, Amgix One behaves predictably when stressed. Rather than crashing or throwing errors, it absorbs excess load into its internal queues. Latencies climb, but the system finds equilibrium at almost any load level. When load drops, recovery is quick. We stress tested to 10,000 concurrent Locust users and observed only 2 errors - both search timeouts at extreme load. This graceful degradation is not accidental. It is a direct consequence of the queue-based architecture that underpins all of Amgix.
When should you move beyond Amgix One? When your load consistently exceeds the numbers in this report, or when you need the independent scaling of API, encoder, and storage tiers that only the distributed Amgix configuration provides. The transition requires no changes to your application - Amgix One and distributed Amgix speak the same API.
We hope this report gives you a clear and honest picture of what Amgix One can handle. Your mileage will vary - but now you have a baseline to reason from.
Coming Soon
This is Part 1 of the Amgix Under Load series. Part 2 will cover distributed Amgix.