Amgix Now Load Tests: Search Only
This post is part of Amgix Now Benchmarks Series
In our previous benchmarks we focused on the relevance and latency metrics of Amgix Now (and three other search engines) across a diverse set of datasets. This report focuses on Amgix Now search performance under concurrent loads. For context, we are also including results from three other popular search engines: Typesense, Meilisearch, and Elasticsearch. We subjected all engines (running with constrained CPU resources) to various levels of concurrent users (from 10 to 1500) to learn how they behave under pressure. Some of the results genuinely surprised us.
Jump to: Benchmarks, Results, or Takeaways
TL;DR in Charts
Benchmarks
Introduction
After testing Amgix Now relevance and latencies across a diverse set of datasets, we set out to find out how the engine performs under different loads of concurrent users in a search-only scenario. Just like in the previous post, we need context for the results, so we are also including results from three other popular search engines: Typesense, Meilisearch, and Elasticsearch, tested under the same conditions.
Test Setup
Expand collapsed sections for details:
Hardware
All tests are performed on a single bare-metal machine with the following specifications:
- CPU: AMD Ryzen™ 9 5900X × 12 cores (24 threads)
- RAM: 64GB
- GPU: NVIDIA GeForce RTX 5060 Ti (16GB)
- Storage: SSD
- OS: Ubuntu 24.04.4 LTS
Note
This is hardly a clean room test setup. It's not even a server. It's a desktop Ubuntu workstation with many other processes running on it at the same time: browser windows, other applications, etc. But we did not have any heavy processes running at the time of the tests.
Methodology
-
Dataset:
- 100K sequential document IDs.
- Each document has two fields:
nameandcontent name: 10 random words generated byFaker().sentence(10)content: 5 random paragraphs generated by"\n\n".join(Faker().paragraphs(5))- Collection/index pre-populated to around 95K records.
-
Queries: 5 random words generated by
Faker().sentence(5) - Random English words for both documents and search queries are meant to somewhat defeat any internal results caching strategies of the search engines.
- Test Harness: Locust with 16 worker processes.
- Locust users fire search requests with a random
0.1to0.5seconds delay. -
Procedure:
- Start a search engine container with the single pre-populated collection/index.
- Ramp up number of Locust users to a desired level.
- Let the system settle for a bit.
- Reset Locust stats.
- Let the system run for a few minutes.
- Take a screenshot of the Locust UI with metrics.
- Record the metrics from the screenshot.
-
All search engines were running in docker containers with a 4 CPU cores limit (8 cores for the final 8-cores tests). Memory was not limited, Elasticsearch heap was set to 16GB.
Server Versions
The following server versions were used for these tests:
- Typesense: 29.0
- Meilisearch: 1.37
- Elasticsearch: 8.19.6
- Amgix Now: 0.1.2
Disclaimer
We are not experts at running and configuring third-party search engines. While we studied the settings and tried to give every system appropriate configuration for the test, it's quite possible that we've missed something and a better configuration may exist. If you notice something in the configuration of these systems that may have affected the test results, please let us know, we'll be happy to re-test with a more optimal configuration.
Collection/Index and Query Configurations
-
Search query results were limited to
10on all systems. -
Typesense:
- We have disabled typo tolerance for the queries. The data contains no typos, so there is no reason to do extra work. Both
num_typosandtypo_tokens_thresholdwere set to0.prefixwas set tofalse. The rest was left at defaults. drop_tokens_thresholdwas also left at default setting. Setting it to zero does improve performance, but at the cost of not finding many relevant documents. See our discussion on the topic in the Typesense on Natural Language Datasets section of the previous benchmarks.
- We have disabled typo tolerance for the queries. The data contains no typos, so there is no reason to do extra work. Both
-
Meilisearch:
- For the same reasons as with Typesense, we disabled typo tolerance on the index. The rest of the settings used defaults.
-
Elasticsearch:
- We used Standard Analyzer with
lowercase,stopand an English stemmer on the index.fuzzinesswas set to0,typeset tomost_fields.
- We used Standard Analyzer with
-
Amgix Now:
- We used
full_texttokenizer to match the other systems (lowercasing, stemming, and stopword removal are done by default).
- We used
Amgix Now File Descriptor Limits
Amgix Now v0.1.1 had the same limitation as Typesense and Meilisearch (see below) with open file descriptors at 1000 concurrent users. We have fixed this in version 0.1.2 and re-ran the tests with the latest version.
Typesense and Meilisearch File Descriptor Limits
Both systems ran into issues with the number of available file descriptors in the container at the 1000 concurrent users level.
Typesense logged: 7 default_variables.cpp:335] Fail to open /proc/self/fd: Too many open files [24]
Meilisearch logged: ERROR actix_server::accept: error accepting connection: No file descriptors available (os error 24)
Both systems stopped accepting new TCP connections at this point.
This issue was easily resolved by setting --ulimit 'nofile=65536:65536' option on the docker run command.
Typesense Thread Pool Exhaustion
Also at 1000 concurrent users, Typesense began reporting (in logs) that its thread pool detected exhaustion:
1 threadpool.h:103] Threadpool exhaustion detected, task_queue_len: 330, thread_pool_len: 192
This was fixed by passing --thread-pool-size=512 to the command with docker run.
Elasticsearch Rate Limit
At 1500 concurrent users, Elasticsearch engine started to return 429 errors for some of the requests.
HTTPError('429 Client Error: Too Many Requests for url: search')
To work around this issue we passed -e "thread_pool.search.queue_size=10000" option to the docker run.
Results
Light Load (10-100 Users), 4 CPU Cores
At the light load levels all the engines are delivering lightning fast results with about the same RPS. Amgix Now edges ahead of the pack by a tiny margin.
Current RPS, as reported by Locust UI, fluctuates; the values in the tables below represent what was captured in our screenshots.
10 Concurrent Users
| Typesense | Meilisearch | Elasticsearch | Amgix Now | |
|---|---|---|---|---|
| p50 (ms) | 5 | 4 | 4 | 3 |
| p95 (ms) | 10 | 4 | 5 | 4 |
| RPS | 32.6 | 32.0 | 33.0 | 32.4 |
100 Concurrent Users
| Typesense | Meilisearch | Elasticsearch | Amgix Now | |
|---|---|---|---|---|
| p50 (ms) | 5 | 4 | 4 | 3 |
| p95 (ms) | 10 | 5 | 6 | 5 |
| RPS | 326.1 | 325.5 | 325.1 | 328.2 |
Medium Load (500-800 Users), 4 CPU Cores
At medium loads is where we begin to see the first signs of the engines starting to run into architectural and/or resource limitations. First at 500, and more dramatically at 800 concurrent users.
500 Concurrent Users
| Typesense | Meilisearch | Elasticsearch | Amgix Now | |
|---|---|---|---|---|
| p50 (ms) | 79 | 3 | 3 | 2 |
| p95 (ms) | 190 | 4 | 6 | 5 |
| RPS | 1302.1 | 1649.2 | 1633.2 | 1647.3 |
800 Concurrent Users
At this load Amgix Now separates from the pack and takes the lead. The other engines begin to show signs of the resource saturation.
| Typesense | Meilisearch | Elasticsearch | Amgix Now | |
|---|---|---|---|---|
| p50 (ms) | 310 | 73 | 71 | 3 |
| p95 (ms) | 440 | 100 | 130 | 8 |
| RPS | 1285.8 | 2127.8 | 2135.5 | 2619.4 |
Heavy Load (1000-1500 Users), 4 CPU Cores
1000 Concurrent Users
At 1000 concurrent users all engines are hitting the wall. Amgix Now was able to increase throughput by around 200 RPS (since 800 users), but the rest of the engines are just growing latencies at this point. The rate of incoming requests is exceeding their processing capacity.
| Typesense | Meilisearch | Elasticsearch | Amgix Now | |
|---|---|---|---|---|
| p50 (ms) | 490 | 150 | 160 | 37 |
| p95 (ms) | 610 | 180 | 220 | 150 |
| RPS | 1265.1 | 2191.3 | 2145.1 | 2865.9 |
1500 Concurrent Users
At this load, throughput of all systems is saturated - nobody was able to move their RPS number at all. Latencies grew.
| Typesense | Meilisearch | Elasticsearch | Amgix Now | |
|---|---|---|---|---|
| p50 (ms) | 910 | 390 | 380 | 220 |
| p95 (ms) | 1200 | 440 | 470 | 300 |
| RPS | 1252.3 | 2180.8 | 2162.6 | 2881.3 |
Heavy Load (1500 Users), 8 CPU Cores
To understand how additional CPU resources affect performance, we repeated 1500-user tests with 8 CPU cores. Every system considerably improved its throughput and lowered the latencies from the 4-core constrained configuration. But Amgix Now is still ahead of the pack, with about 4700 RPS (700 RPS ahead of the runner-up) while serving the requests with 11ms p50 and 35ms p95.
| Typesense | Meilisearch | Elasticsearch | Amgix Now | |
|---|---|---|---|---|
| p50 (ms) | 290 | 69 | 130 | 11 |
| p95 (ms) | 420 | 83 | 170 | 35 |
| RPS | 2490.6 | 4021.1 | 3458.3 | 4734.7 |
Summary, 4 CPU Cores
Throughput (RPS)
| Users | Typesense | Meilisearch | Elasticsearch | Amgix Now |
|---|---|---|---|---|
| 10 | 32.6 | 32.0 | 33.0 | 32.4 |
| 100 | 326.1 | 325.5 | 325.1 | 328.2 |
| 500 | 1302.1 | 1649.2 | 1633.2 | 1647.3 |
| 800 | 1285.8 | 2127.8 | 2135.5 | 2619.4 |
| 1000 | 1265.1 | 2191.3 | 2145.1 | 2865.9 |
| 1500 | 1252.3 | 2180.8 | 2162.6 | 2881.3 |
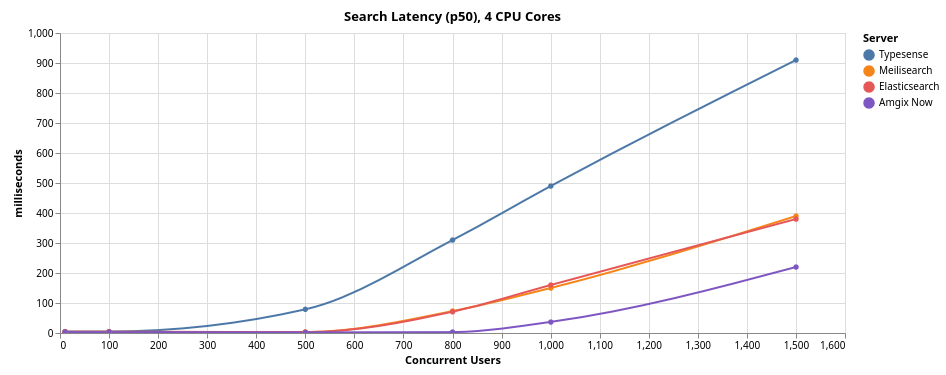
Latency, p50
| Users | Typesense | Meilisearch | Elasticsearch | Amgix Now |
|---|---|---|---|---|
| 10 | 5 | 4 | 4 | 3 |
| 100 | 5 | 4 | 4 | 3 |
| 500 | 79 | 3 | 3 | 2 |
| 800 | 310 | 73 | 71 | 3 |
| 1000 | 490 | 150 | 160 | 37 |
| 1500 | 910 | 390 | 380 | 220 |
Takeaways
-
Amgix Now maintained single-digit millisecond p50 latency up to 800 concurrent users on 4 CPU cores. At 1000 users p50 was 37ms. At 1500 users p50 was 220ms.
-
Throughput scaled consistently: from 32 RPS at 10 users to 2881 RPS at 1500 users on 4 cores, reaching 4734 RPS on 8 cores.
-
No failures were observed at any load level tested. The system degraded gracefully under load without errors, crashes, or dropped connections.
-
Doubling CPU cores from 4 to 8 roughly doubled throughput while significantly reducing latency at the same load levels.
Overall, Amgix Now performed significantly better than we expected when we first set out to run these tests.